Prometheus监控
一、 总览
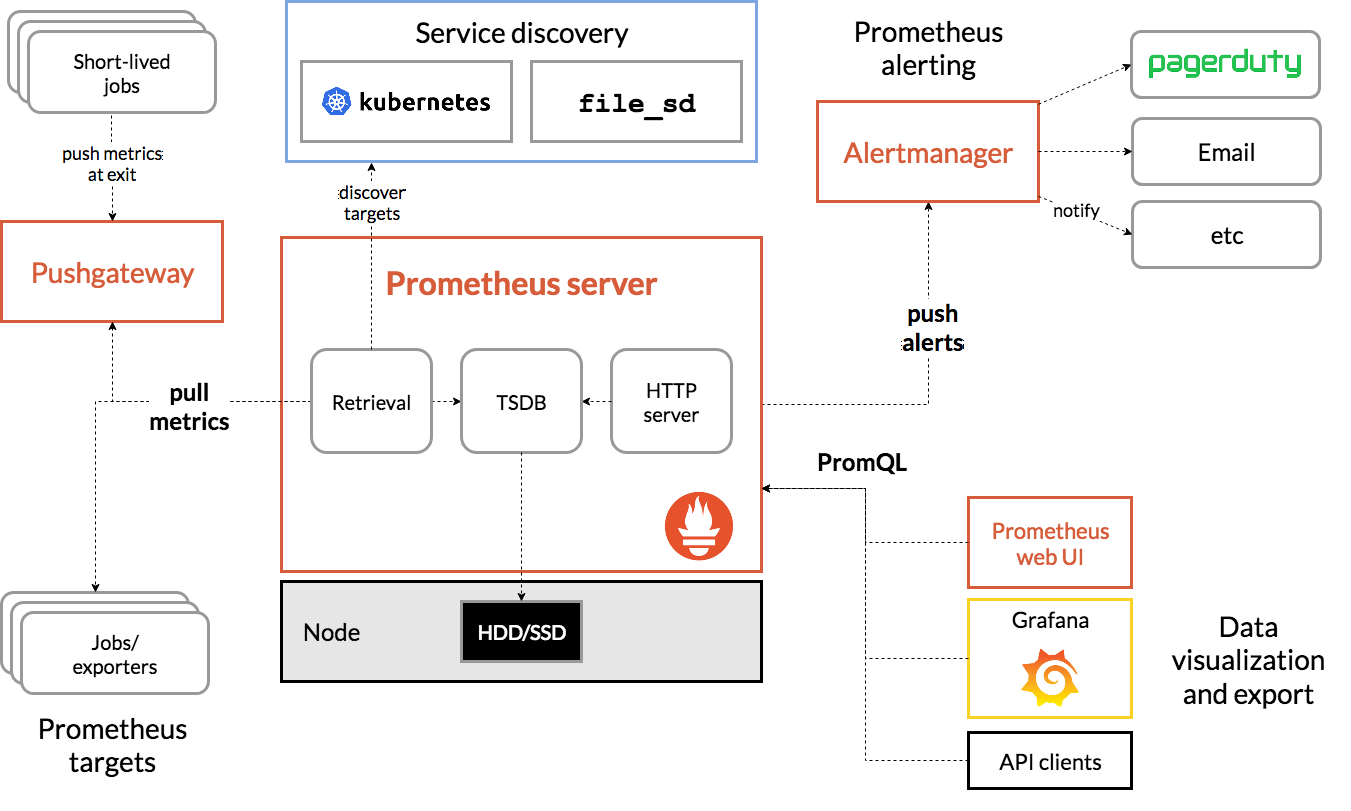
主要组件: Prometheus server: 用于收集和存储时间序列数据 exporter: 客户端生成监控指标 Alertmanager: 处理警报 Grafana: 数据可视化和输出 Pushgateway:主动推送数据给Prometheus server
架构图:
二 、环境搭建
2.1 环境准备
| 软件 | 版本 |
|---|---|
| OS | CentOS Linux release 7.8.2003 |
| docker | 20.10.17 |
| docker-compose | v2.6.0 |
| IP | 192.168.0.80 |
2.2 编辑prometheus配置文件
mkdir /etc/prometheus
vim /etc/prometheus/prometheus.yml
/etc/prometheus/prometheus.yml
# 全局配置
global:
  scrape_interval: 15s
  evaluation_interval: 15s
  # scrape_timeout is set to the global default (10s).
# 告警配置
alerting:
  alertmanagers:
    - static_configs:
        - targets: ['192.168.1.200:9093']
# 加载一次规则,并根据全局“评估间隔”定期评估它们。
rule_files:
  - "/etc/prometheus/rules.yml"
# 控制Prometheus监视哪些资源
# 默认配置中,有一个名为prometheus的作业,它会收集Prometheus服务器公开的时间序列数据。
scrape_configs:
  # 作业名称将作为标签“job=<job_name>`添加到此配置中获取的任何数据。
  - job_name: 'prometheus'
    static_configs:
      - targets: ['localhost:9090']
  - job_name: 'node'
    static_configs:
      - targets: ['localhost:9100']
        labels:
          env: dev
          role: docker
2.3 编辑告警规则文件
/etc/prometheus/rules.yml
groups:
- name: example
  rules:
 # Alert for any instance that is unreachable for >5 minutes.
  - alert: InstanceDown
    expr: up == 0
    for: 1m
    labels:
      serverity: page
    annotations:
      summary: "Instance {{ $labels.instance }} down"
      description: "{{ $labels.instance }} of job {{ $labels.job }} has been down for more than 5 minutes."
2.4 编辑告警配置文件
/etc/alertmanager/alertmanager.yml
global:
  resolve_timeout: 5m
  smtp_smarthost: 'xxx@xxx:587'
  smtp_from: 'zhaoysz@xxx'
  smtp_auth_username: 'xxx@xxx'
  smtp_auth_password: 'xxxx'
  smtp_require_tls: true
route:
  group_by: ['alertname']
  group_wait: 10s
  group_interval: 10s
  repeat_interval: 1h
  receiver: 'test-mails'
receivers:
- name: 'test-mails'
  email_configs:
  - to: 'scottcho@qq.com'
2.5 编辑docker-compose
/docker-compose/prometheus/docker-compose.yml
services:
  prometheus:
   image: prom/prometheus
   volumes:
     - /etc/prometheus/:/etc/prometheus/
     - prometheus_data:/prometheus
   command:
     - '--config.file=/etc/prometheus/prometheus.yml'
     - '--storage.tsdb.path=/prometheus'
     - '--web.console.libraries=/usr/share/prometheus/console_libraries'
     - '--web.console.templates=/usr/share/prometheus/consoles'
     - '--web.external-url=http://192.168.1.200:9090/'
     - '--web.enable-lifecycle'
     - '--storage.tsdb.retention=15d'
   ports:
     - 9090:9090
   links:
     - alertmanager:alertmanager
   restart: always
  alertmanager:
   image: prom/alertmanager
   ports:
     - 9093:9093
   volumes:
     - /etc/alertmanager/:/etc/alertmanager/
     - alertmanager_data:/alertmanager
   command:
     - '--config.file=/etc/alertmanager/alertmanager.yml'
     - '--storage.path=/alertmanager'
   restart: always
  grafana:
   image: grafana/grafana
   ports:
     - 3000:3000
   volumes:
     - /etc/grafana/:/etc/grafana/provisioning/
     - grafana_data:/var/lib/grafana
   environment:
     - GF_INSTALL_PLUGINS=camptocamp-prometheus-alertmanager-datasource
   links:
     - prometheus:prometheus
     - alertmanager:alertmanager
   restart: always

volumes:
  prometheus_data: {}
  grafana_data: {}
  alertmanager_data: {}
2.6 启动composer
docker-compose up -d
2.7 访问端点
- http://localhost:9090 Prometheus server主页
- http://localhost:9090/metrics Prometheus server自身指标
- http://192.168.0.80:3000 Grafana
三、 添加监控主机Job
3.1 安装Node_Export
node_export用于采集主机信息,本质是一个采用http的协议的api
RedHat家族的操作系统可以采用yum进行安装
yum 安装方法: https://copr.fedorainfracloud.org/coprs/ibotty/prometheus-exporters/
curl -Lo /etc/yum.repos.d/_copr_ibotty-prometheus-exporters.repo https://copr.fedorainfracloud.org/coprs/ibotty/prometheus-exporters/repo/epel-7/ibotty-prometheus-exporters-epel-7.repo
yum -y install node_exporter
systemctl start node_exporter
systemctl enable node_exporter.service
二进制文件安装 官网下载地址(https://prometheus.io/download/)
tar -zxvf node_exporter-1.0.0-rc.1.linux-amd64.tar.gz
 ./node_exporter --web.listen-address=:9100
访问地址: http://localhost:9100/metrics
3.2 在promethues中添加该监控
- job_name: 'node'
    static_configs:
      - targets: ['localhost:9100']
        labels:
          env: dev
          role: docker
3.3 重启Prometheus
由于这是静态配置,需要重启Prometheus服务,后面可以做成自动发现的
docker compose restart
四、 配置Grafana
访问http://192.168.0.80:3000/,初始登录账号/密码: admin/admin
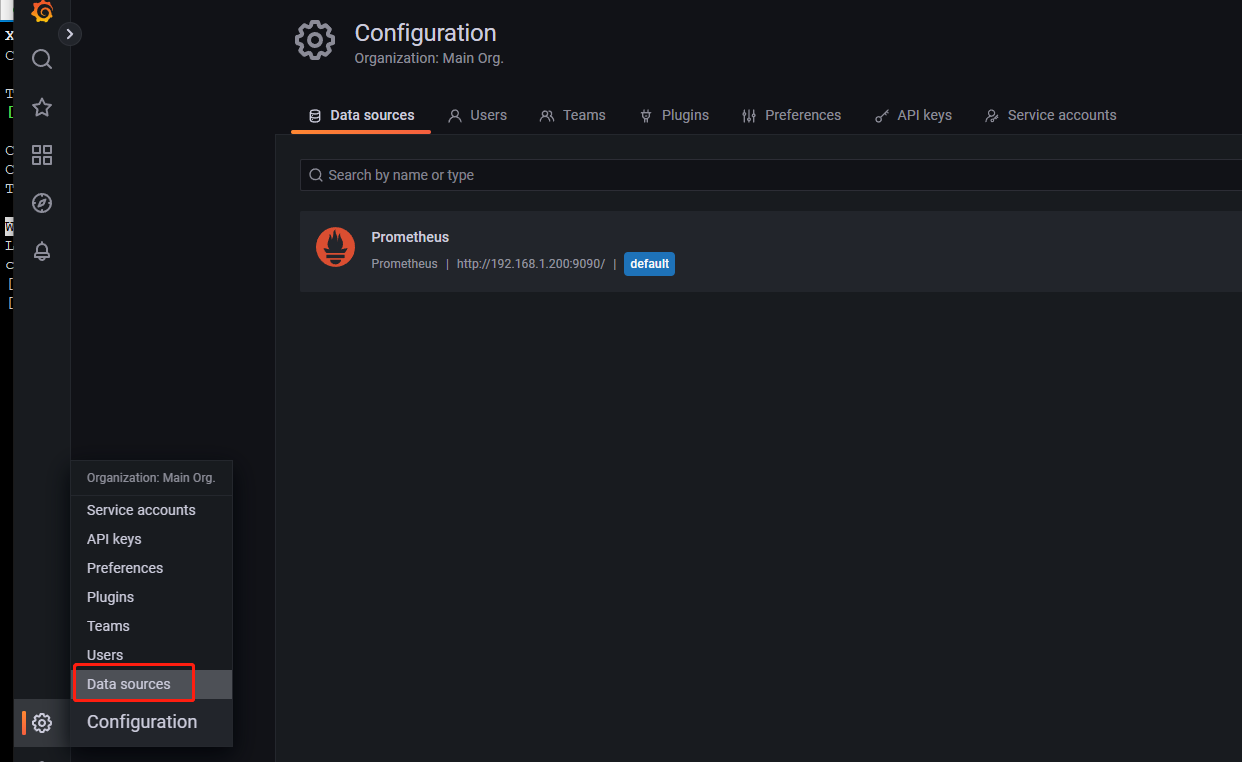
创建Prometheus数据源 单击侧栏中的“齿轮”以打开“配置”菜单。 单击“数据源”。 点击“添加数据源”。 选择“ Prometheus”作为类型。 设置适当的Prometheus服务器网址(例如,http://192.168.0.80:9090/) 根据需要调整其他数据源设置(例如,选择正确的访问方法)。 单击“保存并测试”以保存新的数据源。
2.4.2 导入Node-Export仪表板 官方模板查询地址: https://grafana.com/grafana/dashboards 找到模板编号8919
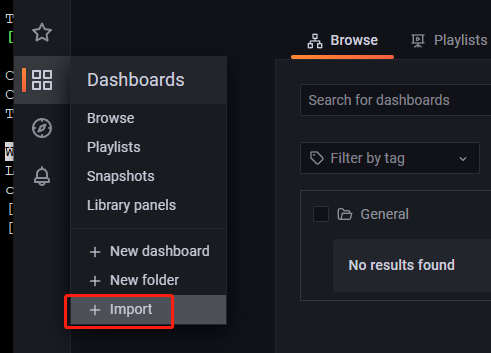
将模板导入到Grafana
左侧菜单找到+图标,点击导入,输入编号,点击Load,然后选择数据源,出现下图
最后点击Import,出现图表

标签: # Docker
留言评论